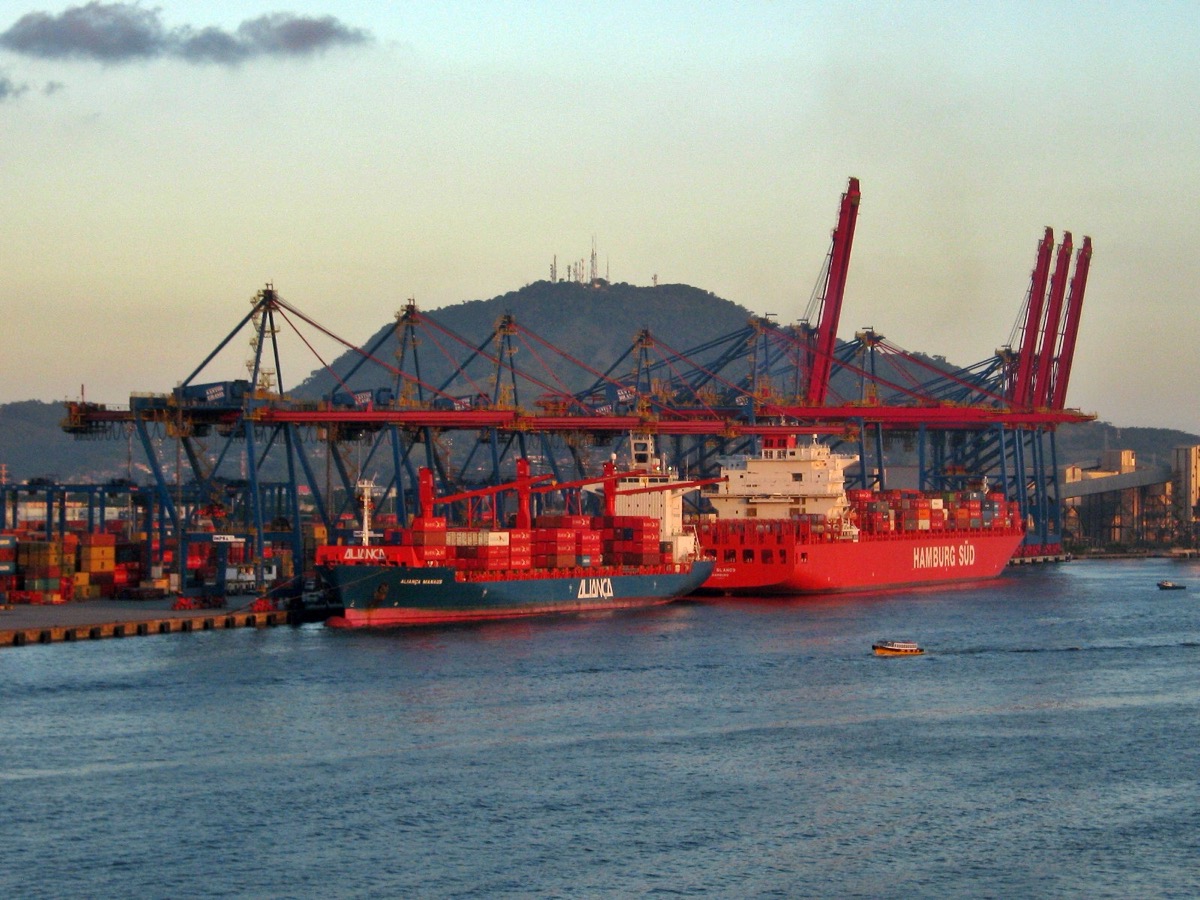
In 2025 Brazil shipped a record $348.7 billion in exports and bought $280.4 billion in imports — a total trade flow of roughly $629 billion that makes Latin America's largest economy one of the most important markets on earth for anyone selling commodities, machinery, or industrial inputs. Brazil trade data turns that enormous flow into named, rankable companies: the soybean crushers buying your equipment, the fertilizer importers you could supply, the iron-ore and coffee exporters you could source from.
Whether you want to sell into Brazil or source commodities out of it, the shipment record is the fastest way to find the right counterparty. This guide walks through Brazil's 2025/2026 trade scale, its top products and partners, and exactly how to use Brazil import data and Brazil export data to build a buyer or supplier list this week.
The 30-second version
- Brazil's exports hit a record $348.7B in 2025 (+3.5%); imports reached $280.4B (+6.7%).
- Top exports: crude oil $44.7B, soybeans $43.5B, iron ore $29.0B, coffee, beef, and sugar.
- Top imports: machinery $47.1B, mineral fuels $30.6B, electronics $30.1B, chemicals, and fertilizers.
- China is the #1 partner — bilateral trade hit a record $171B in 2025; the US is second at $83B.
- Brazil importers and exporters are all in the customs record — searchable by product, HS code, volume, and partner.
How big is Brazil's trade in 2025/2026?
Brazil's foreign trade flow reached about $629 billion in 2025, up 4.9% year on year, according to Brazil's foreign trade ministry figures. Exports grew 3.5% to a historic high of $348.7B, while imports rose a faster 6.7% to $280.4B — leaving a healthy goods surplus of around $68B.
The standout story of the year was diversification. When US tariffs hit Brazilian goods in August 2025, exporters pivoted hard to Asia: shipments to China jumped 28.6% over the August–November window, with November volumes up 42.8% year on year, Agência Brasil reported. That single pivot offset a 25% drop in US-bound sales — and it is exactly the kind of shift that shows up first in shipment-level Brazil export data, weeks before it reaches official summaries.
Brazil is now the world's largest producer or exporter of soybeans, beef, coffee, sugar, and cotton — simultaneously. No other country comes close.
What does Brazil export? The commodity core
Roughly 70% of Brazil's export value sits in three baskets — fuels, agriculture, and minerals. The top eight products in 2025 were crude oil, soybeans, iron ore, coffee, frozen beef, sugar, refined petroleum, and woodpulp, per World's Top Exports.
- Crude petroleum — $44.7B. Brazil's pre-salt offshore fields have turned it into a major crude supplier, with China and the US the biggest buyers.
- Soybeans — $43.5B. Record volume of 108.2 million tonnes shipped in 2025, overwhelmingly to China for animal feed and crushing.
- Iron ore — $29.0B. The backbone mineral export, feeding steel mills in China and across Asia.
- Coffee — $14.9B. A record value despite a volume dip, on historically high green-coffee prices; Brazil remains the world's top exporter.
- Frozen beef — $14.5B. Up roughly 40% in 2025 as Brazil overtook the US to become the world's largest beef producer.
- Sugar — $14.1B. Cane sugar shipped worldwide from the center-south mills.
Brazilian agribusiness as a whole hit a record $169.2 billion in 2025 — about 48.5% of all exports — according to Global Agriculture. If you trade soft commodities, agri-machinery, cold-chain, or packaging, the buyers and sellers behind those numbers are your market.
What does Brazil import? Where sellers find buyers
Brazil's $280.4B import bill is dominated by capital goods and industrial inputs — the opposite of its commodity-heavy exports, and a clear opening for foreign suppliers. The leading categories in 2025:
- Machinery & computers — $47.1B (16.8% of imports), the single biggest bucket and the fastest-growing major category at +14.4%.
- Mineral fuels — $30.6B, including refined diesel and gasoline.
- Electrical machinery & electronics — $30.1B, from components to finished appliances.
- Chemicals & pharmaceuticals, with pharma imports up 17.8% — the fastest-rising segment of all.
- Fertilizers — $7.49B (+14.1%), feeding the soy and sugar belts.
For an exporter, this is the heart of the opportunity. Every one of those flows resolves to specific Brazil importers — company names, the volumes they buy, and how often. That is precisely the kind of targeting customs data lets you do to find buyers instead of cold-guessing. Pesticide and agro-input suppliers in particular should pair this with agrochemical and pesticide export data to map the buyers behind that growing fertilizer and crop-chemical demand.
Brazil's key trading partners
Four relationships dominate Brazil's trade map, and each implies a different play for your business.
China — the anchor partner
Brazil–China bilateral trade hit a record $171 billion in 2025, the highest since records began in 1997, per Global Times. Brazilian exports to China reached $100B (soy, oil, iron ore), while imports from China — machinery, electronics, EVs — totaled $70.9B. China alone accounts for over 27% of Brazil's total trade flow.
United States — second, and reshuffling
US–Brazil trade was about $83B in 2025. After August tariffs, Brazilian exports to the US fell to $37.7B (−6.7%) while imports from the US held near $45B — flipping the balance and pushing Brazilian sellers toward Asia.
Argentina & the EU — the regional and industrial blocs
Argentina remains Brazil's top Mercosur partner and a major buyer of vehicles and manufactured goods, while the EU is a leading destination for coffee, soy, and beef and a key source of machinery and chemicals. The long-negotiated EU–Mercosur deal, if ratified, would reshape these flows again.
One number tells the whole 2026 strategy: as US sales fell 25%, China shipments rose enough to lift Brazil's total exports anyway. Diversification isn't a slogan in Brazil — it's the trade balance.
How to use Brazil trade data — two playbooks
The same dataset works whether you're selling to Brazil or sourcing from it. New to the concept? Start with our beginner's guide to import-export trade data, then run one of these.
Playbook 1 — Selling INTO Brazil
- Pick the HS code for your product (e.g. agricultural machinery, lab reagents, pump components).
- Pull every Brazil import shipment under that code for the last 12–24 months.
- Rank the Brazil importers by volume and frequency — your hottest prospects buy most often.
- See which foreign suppliers they already use, then pitch on price, lead time, or quality.
- Reach the decision-maker with contact intelligence where available, and skip the gatekeeper.
Playbook 2 — Sourcing FROM Brazil
- Search export shipments for your commodity — soybeans, coffee, beef, sugar, woodpulp, iron ore.
- List the exporters actually shipping at scale to destinations like yours.
- Cross-check volumes and consistency before you ever send a deposit.
- Always verify the supplier before paying — the shipment record is your first proof they're real and active.
How ShipScout helps with Brazil trade data
ShipScout turns the global shipment record into ready-to-use buyer and supplier lists — the affordable SME alternative to Panjiva, ImportGenius, and Volza.
- 240+ countries, 11B+ records — Brazil import and export shipments alongside every major market, so you can track a commodity end to end.
- Ranked by volume — see the biggest Brazil importers and exporters first, not a random list. Browse the live Brazil company directory to start.
- Contact intelligence where available — reach decision-makers directly instead of filling out a website form.
- Cross-market view — compare Brazil sourcing against China or US suppliers in the same search, then act on the best lane.
You can map Brazil's $629B trade flow to named companies in minutes. Start a free trial and pull your first Brazil buyer or supplier list today.
See who’s importing Brazil importers right now.
ShipScout turns 11B+ shipment records across 240+ countries into a live list of verified buyers and suppliers — ranked by volume, with the contacts to reach them. Create a free account and run your first search in minutes.
Start your free trial →