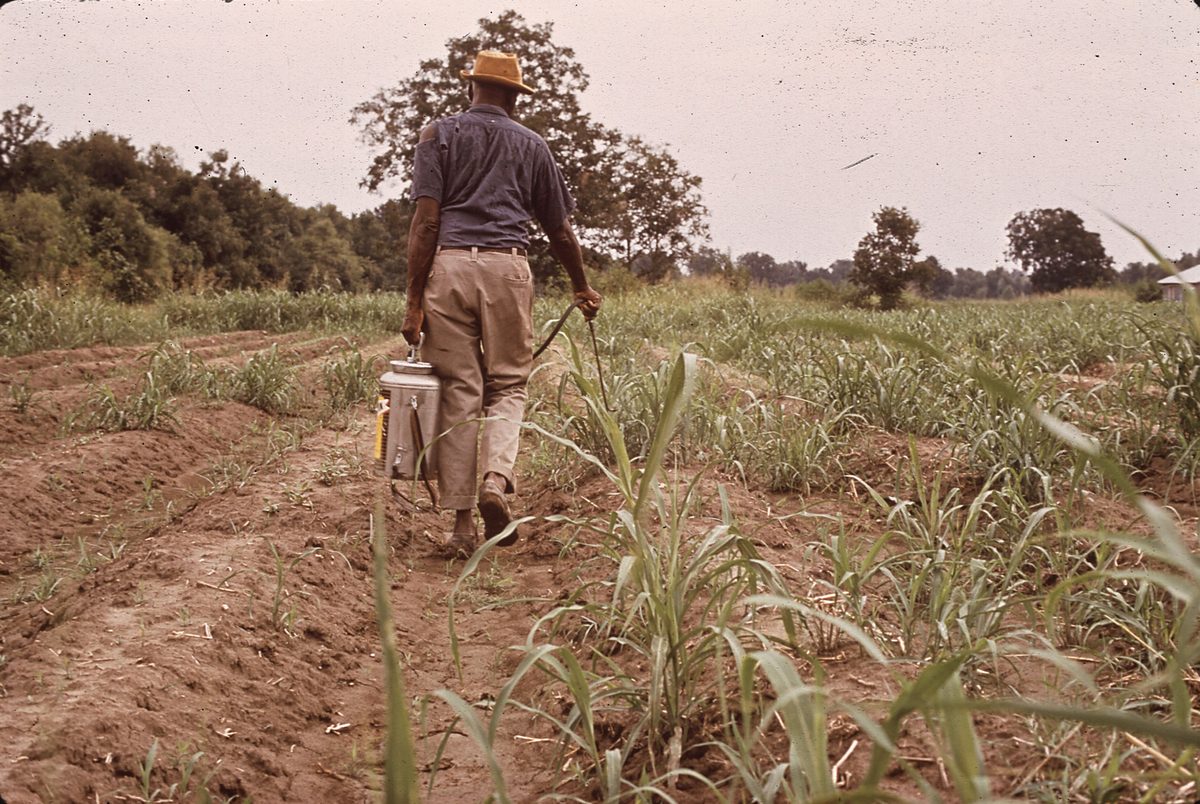
Every drum of glyphosate that leaves an Indian port and lands in São Paulo or Ho Chi Minh City is a sales lead someone already won. The buyer signed a contract, cleared a port, paid for a shipment of crop protection chemicals — and unless you were watching the trade lanes, you never knew the deal existed. That is the brutal asymmetry of the agrochemicals trade: the demand is enormous, repeat-heavy, and concentrated in a handful of countries, but most exporters chase it blind, emailing cold and hoping.
It does not have to work that way. The same global shipment records that prove who bought technical grade pesticides last quarter — and how much — are sitting in trade databases right now. This is a field guide to the agrochemical buyers actually moving volume in 2025–26, where they are, and how to put your pesticide formulations in front of them before your competitor does.
The 30-second version
- India's agrochemical exports hit US$3.3 billion in FY2024-25, making it the world's third-largest exporter after China and the United States — nearly triple the US$1.3B of a decade ago.
- The global crop protection chemicals market is worth roughly US$83 billion in 2025, on track for ~US$106 billion by 2030 at a 5% CAGR.
- Herbicides are the breakout export segment, growing ~20% CAGR (FY20–FY25); the US holds the #1 spot and Japan displaced Brazil as #2 for herbicides in FY2025.
- HS code 3808 exports from India climbed from ₹22,090 crore (FY18-19) to ₹36,141 crore in FY2024-25 — an 8.55% annual climb across the full pesticide chapter.
- Roughly 50% of technical-grade active ingredients are still imported from China, the gap driving the China+1 shift straight toward Indian suppliers.
The numbers exporters are not paying attention to
Start with scale. India's agrochemical exports reached US$3.3 billion in FY2024-25, ranking the country third globally behind China and the United States — up from US$1.3 billion ten years earlier. Exports now make up 51% of the sector by value, with insecticides at 41%, herbicides at 22%, and fungicides at 21% of the mix. This is no longer a domestic industry that occasionally ships abroad. It is an export machine.
The opportunity sits on top of a market that keeps expanding. The global crop protection chemicals market is estimated at US$83.32 billion in 2025 and projected to reach US$106.26 billion by 2030 at a 5.0% CAGR. Widen the lens to all agrochemicals — fertilizers included — and you are looking at a market that grew from roughly US$299.7 billion in 2025 toward US$315.3 billion in 2026. Food demand does not pause. Pests, weeds, and fungi do not negotiate. The demand floor under crop protection chemicals is about as durable as demand gets.
Then look at the segment story, because it tells you where to aim. Per the Rubix Data Sciences report, herbicides are now India's fastest-growing export segment at ~20% CAGR from FY2020 to FY2025, lifting their share of the export basket from 31% to 37%. Glyphosate, 2,4-D, atrazine and other herbicides are riding the front of that wave, while insecticides and fungicides still command the largest absolute slice.
Where the buyers actually are
Geography is everything in this trade, and the destination map is sharper than most exporters assume. For insecticides and fungicides, the US and Brazil have held the top two spots for five straight years. For herbicides, the US keeps #1 while Japan displaced Brazil as the #2 destination in FY2025. And concentration is the headline: the top five destinations account for over 50% of insecticide/fungicide exports and nearly 71% of herbicide exports.
Seventy-one percent of herbicide demand sits in five countries. You do not need a thousand leads — you need the right thirty buyers in Brazil, the US and Vietnam, ranked by volume.
Brazil is the gravitational center of agrochemical demand — soybean, sugarcane and corn acreage on a continental scale, and an import appetite to match. The US runs the largest formulated-product market and the deepest distribution networks. And Southeast Asia — Vietnam especially — is the fast-rising third pole, where rice, coffee and fruit growers are pulling in pesticide formulations at pace. Companies appearing in import records, like Pesticide Nhat Ban Company Limited in Vietnam, hint at how active that corridor has become.
The China+1 tailwind no exporter should ignore
Here is the structural shift working in your favor. Roughly 50% of technical-grade active ingredients are still imported from China, and global buyers are actively de-risking that dependence. Every importer in Brazil, the US or Europe hunting for a second source is a buyer you can win — if you can see who they are and what they currently buy. The China+1 reshuffle is not a slogan; it is a live reallocation of multi-million-dollar contracts, and Indian agrochemical exporters are the obvious beneficiary.
The momentum shows up in the trade figures too. India's exports under HS code 3808 — the full pesticide chapter — grew at 8.55% CAGR from ₹22,090 crore in FY2018-19 to ₹36,141 crore in FY2024-25. India is now among the world's top exporters under HS code 3808, ahead of China and Turkey. The lane is wide open. The only question is whether you are routing your outreach down it with a map, or guessing.
How to find agrochemical buyers with ShipScout
ShipScout.ai turns 11B+ shipment records across 240+ countries into a buyer list you can actually call. Here is the workflow real exporters run:
1. Find buyers by HS code
Search HS code 3808 (or drill into glyphosate, mancozeb, 2,4-D, specific insecticides, herbicides or fungicides) and instantly surface every importer pulling that product into a given market. No more guessing which companies actually buy technical grade pesticides versus finished pesticide formulations — the shipment trail tells you. Start at the company directory.
2. Rank the importer list by volume
Sort buyers by shipment volume so you call the biggest fish first. Targeting Brazil's soybean belt? Pull the Brazil importer list. Chasing the US formulated-product market? Open US importers. Riding the Southeast Asia wave? Start with Vietnam importers. Each list is ranked by real trade volume, not vanity.
3. Vet suppliers before you commit
Sourcing technical material or contract manufacturing? Verify a counterparty's actual trade footprint before you wire a deposit. Cross-check a prospective overseas supplier against their shipment history to confirm they ship what they claim, at the volume they claim.
4. Track competitors lane by lane
See who your rivals ship to, which markets they are gaining in, and where a buyer just switched suppliers — your cue to step in. The same records that map demand also map the competitive battlefield in real time.
It costs nothing to look. Start a free trial, search HS code 3808, and see the agrochemical importers in your target market ranked by volume in the next ten minutes.
See who’s importing agrochemicals right now.
ShipScout turns 11B+ shipment records across 240+ countries into a live list of verified buyers and suppliers — ranked by volume, with the contacts to reach them. Create a free account and run your first search in minutes.
Start your free trial →