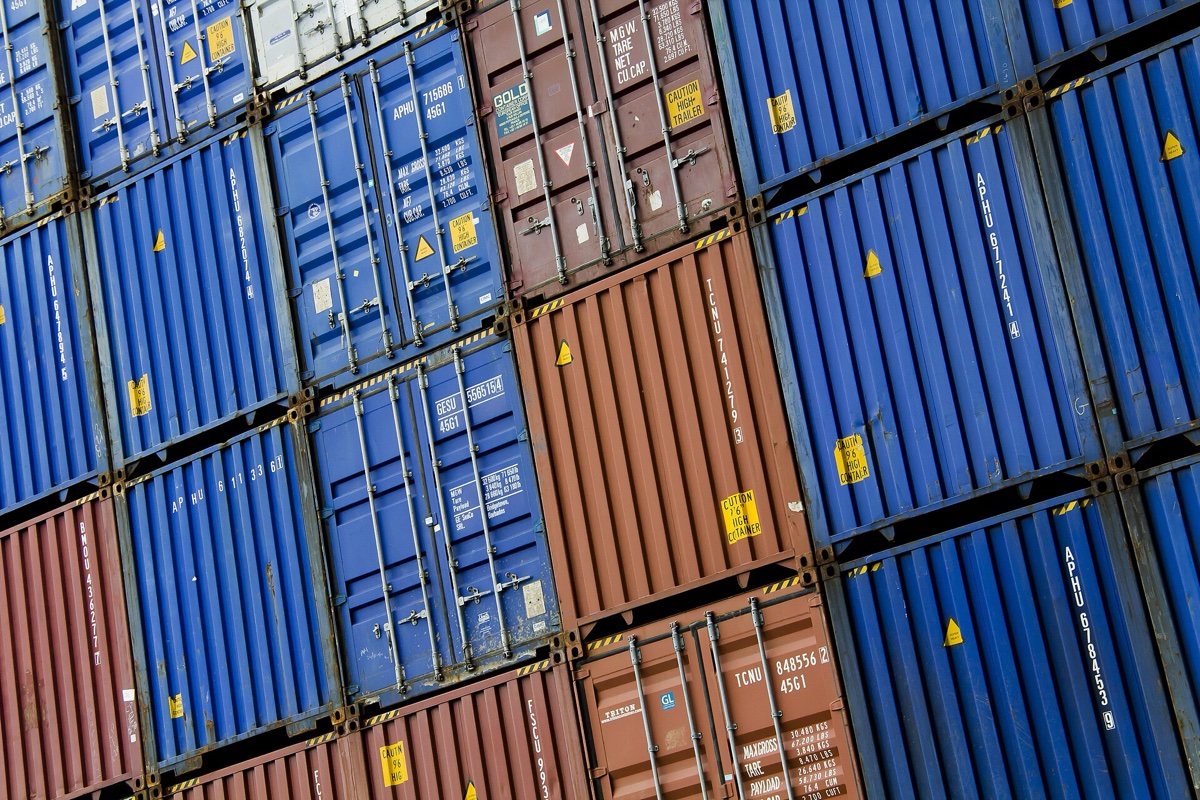
Rotterdam moved 428.4 million tonnes of cargo in 2025 and handled 14.2 million TEU of containers, more than any other port in Europe, per the port's full-year figures. Behind that wall of steel sits an odd national ledger. The Netherlands, a country of 18 million people, imported €585.8 billion of goods in 2024 and exported €666.5 billion, per CBS, the Dutch statistics office. It runs a surplus not because it makes everything it sells, but because half of what it ships out was made somewhere else. This guide breaks down Netherlands import data for 2026: what the Dutch buy, who supplies them, how Rotterdam's re-export economics work, and how to turn shipment records into a ranked list of Dutch importers.
The 30-second version
- The Netherlands imported €585.8 billion of goods in 2024, the world's 8th-largest import bill, while ranking as the 4th-largest goods exporter.
- Germany supplied €97.6B, the US €59.7B, Belgium €57.2B, China €51.3B; 58% of imports come from Europe.
- Rotterdam's 2025 count: 428.4 million tonnes, 14.2 million TEU (+3.1%), with full-container imports from Asia up 9.3%.
- Roughly half of Dutch exports are re-exports, and they earn just €0.11 per euro against €0.53 for domestically made goods.
- The Netherlands is India's 3rd-largest export destination: $22.76 billion in FY2024-25, the biggest lane into Europe.
What does the Netherlands import the most?
Machinery and equipment lead at 24% of the 2024 import bill, ahead of manufactured goods (23%), mineral fuels (18%), chemical products (14%) and food and beverages (11%), per CBS. At product level, the top three are crude petroleum, refined petroleum (HS 2710) and phones, modems and routers (HS 8517).
| Category | Share of 2024 imports | Key HS chapters |
|---|---|---|
| Machinery and equipment | 24% | 84, 85 |
| Manufactured goods | 23% | 39, 72, 94 |
| Mineral fuels and oils | 18% | 27 |
| Chemical products | 14% | 28–38 |
| Food and beverages | 11% | 02–22 |
The fastest riser is computing hardware. Dutch imports of computers, laptops and tablets (HS 8471) came in €5.0 billion higher in 2024 than the year before, the biggest jump of any top-15 product, as AI-driven data-centre buildouts pulled hardware through Schiphol and Rotterdam. New to chapter codes? Start with how HS codes work.
On the supplier side, Germany dominates at €97.6 billion, followed by the US at €59.7 billion (LNG, machinery, pharma), Belgium at €57.2 billion, China at €51.3 billion and the UK at €27.2 billion; the UK import data picture shows that last lane from the other end. In total, 58% of Dutch goods imports come from Europe, including €279 billion from fellow EU member states.
Where does Netherlands import data come from?
Two official layers, both aggregate: CBS (Statistics Netherlands) publishes monthly and annual goods trade by product and partner country, and Eurostat republishes the same flows EU-wide under its Comext database. Both are free, reliable and completely anonymous.
That last part is the catch. The EU, unlike the United States, does not release bill-of-lading manifests or consignee names, so no official Dutch source will tell you who imported polypropylene into Venlo last quarter. Practitioners close the gap with mirror data: partner-country shipment records showing who shipped what into the Netherlands, joined with licensed shipment databases that carry Dutch consignee names where disclosure rules allow. The mechanics are the same as finding buyers with customs data anywhere else, and a quick read on how to read a bill of lading covers the fields you will be ranking on.
Rotterdam port data: inside Europe's biggest gateway
Rotterdam is Europe's largest seaport and the largest anywhere outside Asia, per its long-held ranking. From its quays, the port authority counts connections to more than 1,000 ports and a market of 500 million consumers reachable within 24 hours by barge, rail or truck. Clear customs once at Rotterdam and the goods circulate freely across the entire EU single market. That is the whole gateway pitch in one sentence.
The 2025 numbers show the machine straining, though. Total throughput slipped 1.7% to 428.4 million tonnes while container volume grew 3.1% to 14.2 million TEU, per full-year throughput data. Underneath, full-container imports from Asia jumped 9.3% and North America 16%, while transshipment fell about 16% as quay congestion pushed volume to rival ports, per the Port of Rotterdam's container-year review. Since 2020 the gap between inbound and outbound boxes has widened by 1.47 million TEU.
Rotterdam's 2025 story in one line: more full boxes arriving from Asia and America, fewer leaving full, and a growing pile of empties. That imbalance is the physical signature of a continent buying more than it ships back, and every one of those inbound containers has a consignee.
What Netherlands import data reveals about the re-export machine
About 37% of everything the Netherlands imports leaves the country again as re-exports, per CBS's 2025 trade review. In 2024, re-exports and domestically made exports each took roughly half of the €666.5 billion export total, and in 2022 re-exports actually outgrew domestic exports. The nearer the destination, the stronger the effect: 60% of Dutch exports to Germany and 55% to Belgium are re-exports, against 30% to the US and 16% to China.
The economics are thin by design. A euro of re-exports leaves about €0.11 of value added in the Dutch economy, versus €0.53 for domestically produced goods and €0.64 for services, per the OECD's 2025 Netherlands survey. Margins that skinny only work at volume, which is why the Dutch built distriparks, bonded warehouses and Europe's densest broker network around the port.
For an exporter, the practical lesson is about sizing. One food-products exporter kept quoting a Rotterdam distributor volumes scaled to Dutch supermarket demand, then noticed in shipment records that the buyer's intake ran at four times what the domestic market could absorb. The "Dutch" customer was really a European one, buying for Germany and Scandinavia. The next quote tripled, and won.
The India–Netherlands lane: a top-three destination
India exported $22.76 billion of goods to the Netherlands in FY2024-25, about 5.12% of its total merchandise exports, per IBEF. That makes the Netherlands India's third-largest export destination after the US and the UAE, and its biggest in Europe, a slot it first claimed in 2023-24 by overtaking China. The current year is running softer on fuel prices: April–January of FY2025-26 logged $15.33 billion, still 5.20% of India's exports, per the Indian Embassy in The Hague.
Petroleum products (HS 27) anchor the lane at $7.11 billion, with electrical machinery (HS 85) at $990 million, organic chemicals (HS 29) at $632 million and mechanical machinery (HS 84) at $363 million, alongside drug formulations, cotton garments, and iron and steel. Because so much of what lands in Rotterdam moves on to the rest of the EU, one well-chosen Dutch buyer can open several markets at once. That is exactly the kind of call data-backed targeting settles: exporters build a shortlist of consignees whose recorded volumes match their capacity before writing a single email.
How do you find Dutch importers?
Since no EU register names consignees, you work from mirror shipment records and rank from there. The sequence that works:
- Fix the HS code first. Dutch and EU buyers filter on 6-digit headings plus CN subheadings; a wrong chapter poisons every later step.
- Pull mirror shipment records. Partner-country export data shows shipments into the Netherlands with product, value, volume and, where available, the Dutch consignee.
- Rank by consistency, not size. Twelve shipments a year marks a working distributor; one spike is often a project buy.
- Read the re-export angle. A consignee whose volumes dwarf Dutch domestic demand is a European distribution hub. Bigger prize, longer qualification, and CE, REACH or food-safety paperwork from day one.
- Verify before quoting. Cross-check trade history and registry records, then open with the buyer's own numbers.
A chemicals exporter shortlisting Dutch buyers skipped the two household-name traders and pitched the mid-table consignees ranked #5 to #9 by shipment count. Three responded within a fortnight. Mid-size importers answer their own email.
How ShipScout helps
ShipScout puts 11B+ shipment records across 240+ countries behind one search box, including the Netherlands import data trail visible through partner-country records:
- Search your product or HS code with the Netherlands as destination and see real flows: values, volumes, origins, dates.
- Rank Dutch importers by shipment count and consistency instead of trusting directory listings.
- Profile before pitching. Open any company in the importer directory to see trade history, sourcing countries and product mix, including whether it re-exports.
- Reach out with contact intelligence where available, leading with numbers from the buyer's own lane.
A €585.8 billion import bill funneled through one river delta means somebody in the Netherlands is already buying what you make. Start a free trial and pull your first ranked list of Dutch buyers today.
See who’s importing goods into the Netherlands right now.
ShipScout turns 11B+ shipment records across 240+ countries into a live list of verified buyers and suppliers — ranked by volume, with the contacts to reach them. Create a free account and run your first search in minutes.
Start your free trial →