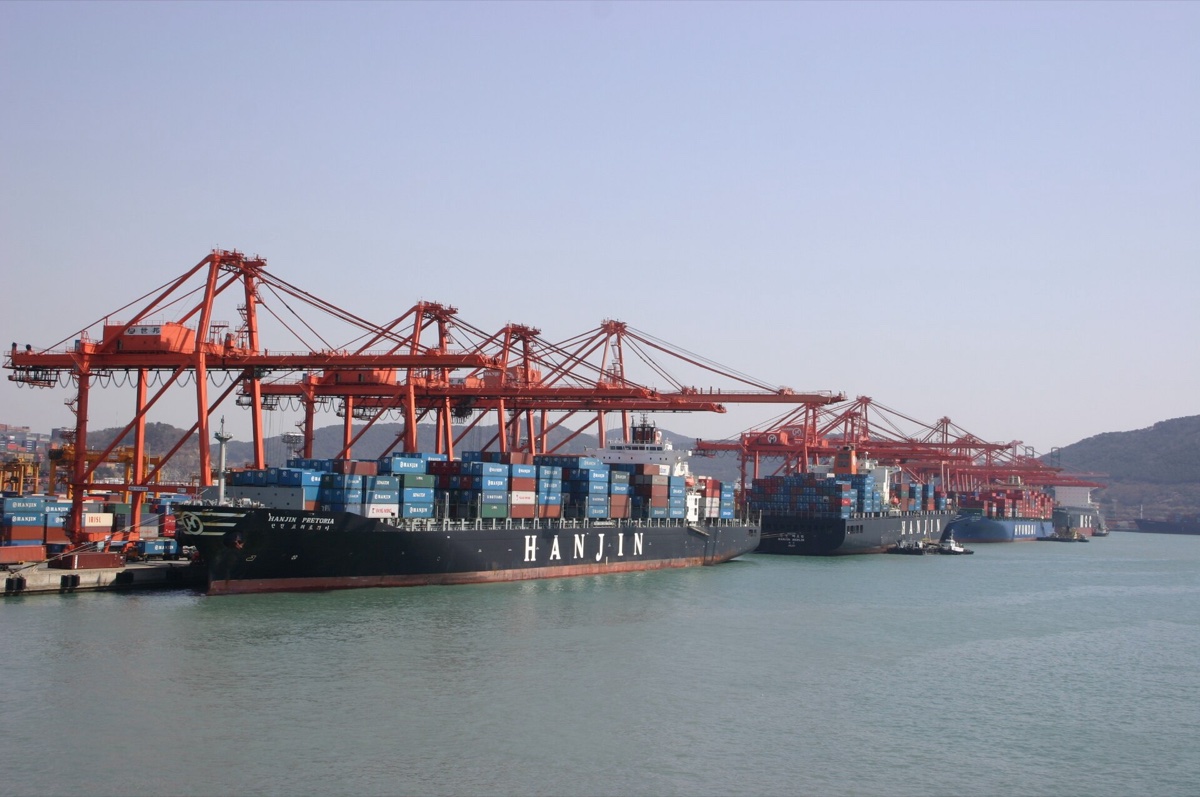
South Korea shipped a record $709.7 billion of exports in 2025, the first time it crossed the $700B line. The half everyone overlooks is what it bought: $631.7 billion of imports, per the trade ministry's January 2026 release. South Korea import data reads like a shopping list for a country that manufactures everything and extracts almost nothing: crude oil, LNG, chip-making machines, industrial metals, and food it cannot grow at home. The energy bill alone ran $117.4 billion in 2025, per the Korea Herald. This guide covers what Korea buys, where Korea customs data actually lives, and how exporters turn both into a ranked list of Korean importers.
The 30-second version
- Korea imported $631.7 billion of goods in 2025 (flat year on year) against record exports of $709.7B, leaving a $78.0B surplus.
- Mineral fuels ($140B), electrical machinery ($127.5B) and machinery including computers ($74.7B) dominate the import mix.
- China supplied $141.9B, roughly 22% of everything Korea buys; the US ($73.7B) and Japan ($48.8B) follow.
- Korea publishes aggregate trade statistics through UNI-PASS but no importer names. Buyer identities come from mirror data.
- India shipped $6.0B to Korea in FY2025-26 against a $15.35B deficit; CEPA 2.0 talks aim to double trade to $54B by 2030.
What does South Korea import the most?
Mineral fuels led South Korea's 2025 imports at $140 billion (22.2% of the total), ahead of electrical machinery and equipment at $127.5 billion (20.2%) and machinery including computers at $74.7 billion (11.8%), per Worldstopexports' breakdown of 2025 trade data.
Inside those chapters, two line items tell the 2026 story. Crude oil came in at $75.3 billion, down 11.9% on softer prices. Semiconductor-making machinery jumped 16.6% to $21.8 billion, because the same AI boom that pushed Korea's chip exports up 22.2% to $173.4 billion (per Trading Economics) forces its fabs to buy foreign equipment first. Korea also imports the bulk of its wheat, corn, oilseeds and beef. A country of 51 million with thin farmland is a permanent food buyer, which matters for the India lane below. New to reading these HS chapters? Start with how HS codes work.
Where does South Korea import data come from?
The official layer is genuinely good, and genuinely anonymous. The Korea Customs Service trade statistics portal (part of UNI-PASS) publishes monthly import and export figures compiled from actual clearance declarations, cut by HS code, partner country and port, with corrections posting around the 15th of each month. For market sizing, Korea customs data is faster and cleaner than most national sources.
What it never gives you is a name. Korea does not release bill-of-lading manifests or consignee identities the way the US does, so you cannot pull a Seoul buyer from an official database. Practitioners close the gap with mirror data: partner-country export records showing who shipped what into Korea, layered with licensed trade databases that carry consignee names where disclosure rules allow. The workflow is the same one used for other closed markets, and it starts with customs data from the open side of the lane.
Korea will tell you the tonnage of every HS line it cleared last month. It will not tell you who cleared it. That single gap is the whole reason mirror data exists.
Who are South Korea's top import partners?
China, at $141.89 billion, supplies more than the next two sources combined, per UN COMTRADE figures via Trading Economics. The full top table:
| Rank | Supplier | Imports into Korea |
|---|---|---|
| 1 | China | $141.9B |
| 2 | United States | $73.7B |
| 3 | Japan | $48.8B |
| 4 | Australia | $32.1B |
| 5 | Vietnam | $31.8B |
| 6 | Saudi Arabia | $27.4B |
| 7 | Germany | $21.6B |
Each rank has a logic. Australia sells Korea coal, iron ore and LNG. Vietnam's slot is mostly Korean electronics giants shipping components back from their own Vietnamese assembly plants. Saudi Arabia is crude, the same barrels that make Riyadh a top-five supplier (see how Saudi trade data mirrors this from the other side). For any new supplier, the pitch writes itself: Korea's import bill held at $631.7B even while its exports boomed, and Seoul has spent two decades deliberately diversifying away from single-source dependence.
South Korea import data and the India-Korea CEPA corridor
India shipped $6.0 billion to Korea in FY2025-26, up 3.31% from $5.81B, while imports from Korea grew to $21.35 billion. That leaves a $15.35 billion deficit, up from $9.4B in FY2021-22, per figures reported by Business Standard. The imbalance is precisely why the two governments are renegotiating. The 12th round of CEPA upgrade talks ran in New Delhi in late May 2026, covering goods, services, rules of origin and new sub-groups on digital trade and supply chains, per The Pioneer. The stated target: double bilateral trade to $54 billion by 2030.
What does India actually sell Korea? Machinery and mechanical appliances ($699.8M), mineral fuels ($632.2M), organic chemicals ($407.0M), aluminium ($337.7M) and iron and steel ($264.1M) led the FY26 tally through November 2025, per IBEF. One practical note from exporters who work this lane: CEPA's concessional tariff only applies with a valid certificate of origin, so the paperwork discipline decides whether the duty advantage is real. Most teams build the buyer list first with data-backed targeting, then price with CEPA rates in hand.
Three lanes worth watching: steel, chemicals, food
Steel (HS 72). Korea was India's largest finished-steel supplier in FY2024-25 at 2.8 million tonnes, a 29% share of India's finished-steel imports, per Argus Media. Then India imposed a 12% safeguard duty on flat steel from April 21, 2025, stepping down to 11.5% and 11% over three years, per Outlook Business. The duty repriced the lane overnight; traders who work it now rebuild landed-cost sheets monthly and watch which Korean mills keep shipping through the tariff.
Chemicals (HS 29). Organic chemicals are India's third-biggest export line to Korea at $407M in eight months. Korean formulators buy intermediates and agrochemical inputs continuously, and chemical shipments are exactly the kind of repeat, spec-driven business where shipment history separates a real buyer from a trading-house middleman.
Food (HS 12, 120740 for sesame). Korea's sesame imports jumped 26% to 90,460 tonnes in 2024 (historical baseline), with India the second-largest supplier after growing 23% to 21,863 tonnes, per Mundus Agri. Gujarat hulled-sesame exporters treat Korea as a premium-price anchor market and track the Korea-Japan price spread before committing containers; the full lane breakdown is in our sesame export data guide.
The safeguard duty did not kill the Korea-India steel lane. It repriced it. The importers still buying through a 12% duty are the ones worth knowing.
How do you find Korean importers?
Since Korea publishes no consignee records, you triangulate. The sequence export teams actually run:
- Fix your HS code first. Korean tariff lines follow the standard 6-digit system; a wrong chapter poisons every later filter.
- Pull mirror data. Partner-country export records show shipments into Korea with product, value, volume and consignee names where disclosure allows.
- Rank Korean importers by shipment count. Twelve steady shipments a year signals a distributor; one giant shipment usually signals a project buy.
- Screen for compliance readiness. Food entering Korea clears Ministry of Food and Drug Safety import inspection; a buyer already importing your HS code has an approval trail.
- Verify before you quote. Match the company against its own trade history, then open with their numbers, not your brochure.
How ShipScout helps
ShipScout puts 11B+ shipment records across 240+ countries behind one search, including the South Korea import data trail visible through partner-country records, so the triangulation above takes minutes instead of weeks:
- Search your product or HS code with South Korea as destination and see real shipment flows, values and origin countries.
- Rank the buyers. Get Korean importers ordered by shipment volume and frequency, not by directory ad spend.
- Profile before pitching. Open any company in the importer directory to see trade history, sourcing mix and supplier switches.
- Reach out with contact intelligence where available, and lead the email with their own import pattern.
Korea's $631.7 billion buying program is published every month, one HS line at a time. The names behind it are findable too. Start a free trial and pull your first ranked list of Korean buyers today.
See who’s importing goods into South Korea right now.
ShipScout turns 11B+ shipment records across 240+ countries into a live list of verified buyers and suppliers — ranked by volume, with the contacts to reach them. Create a free account and run your first search in minutes.
Start your free trial →