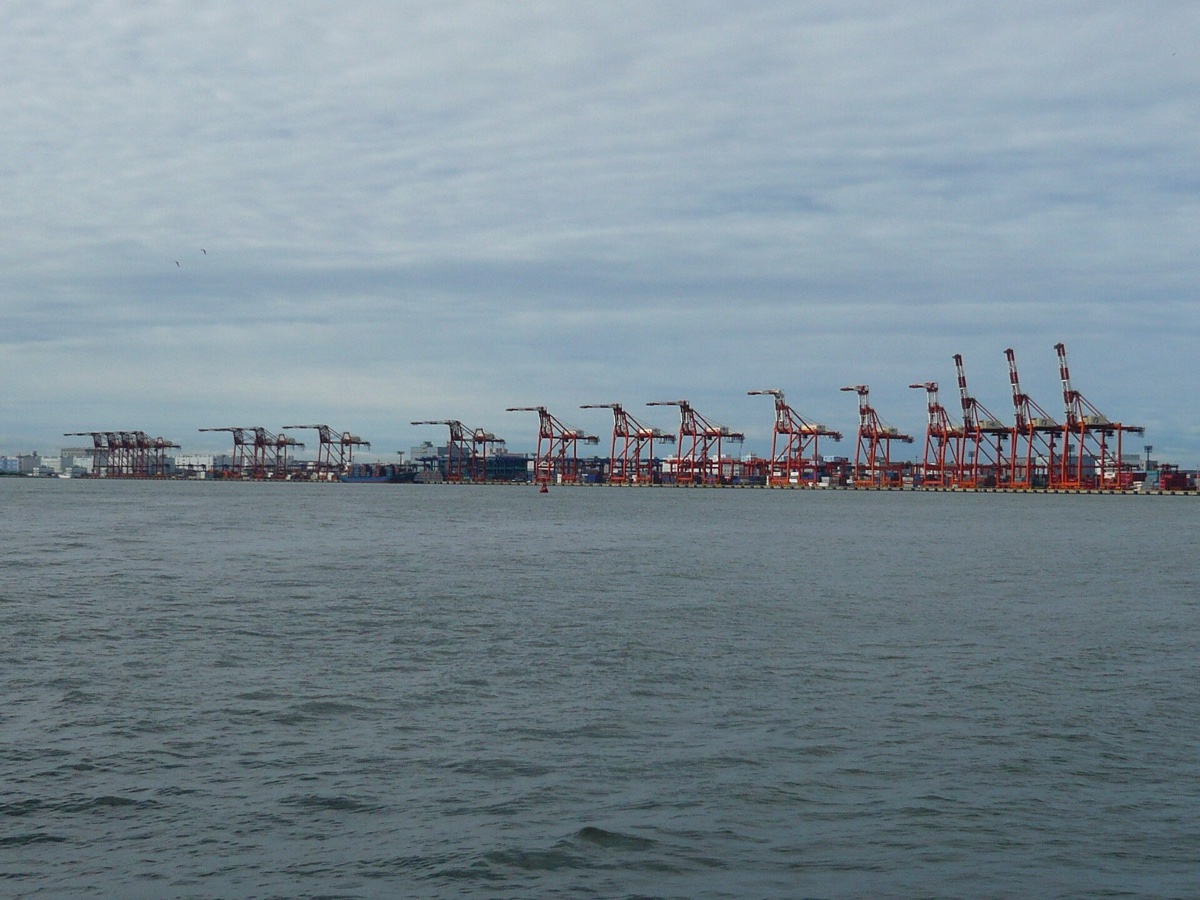
Japan closed 2025 with an import bill of ¥113.1 trillion, roughly $755.5 billion, the second-highest on record, against record exports of ¥110.4 trillion, per Ministry of Finance preliminary figures. The gap left a ¥2.7 trillion deficit, the fifth straight year in the red. That streak is the story hiding in Japan import data: the world's fourth-largest economy builds cars and machine tools brilliantly, yet must buy its fuel, most of its calories and a rising share of its medicine abroad. This guide covers what Japan bought in 2025, who supplied it, where the official numbers live, and how to turn shipment records into a ranked list of Japanese importers.
The 30-second version
- Japan imported ¥113.1 trillion (~$755.5 billion) of goods in 2025; the ¥2.7T deficit was its fifth straight, but 52.9% smaller than 2024's.
- Mineral fuels ($147.9B), electrical machinery ($114B) and machinery including computers ($82.9B) lead; machinery grew fastest at +13.8%.
- China supplied ¥12.85 trillion in H1 2025 alone, about 23% of the bill; Asia as a whole covered nearly half.
- JBIC's FY2025 survey ranks India the most promising expansion market for the 4th year running, named by over 60% of Japanese manufacturers.
- Japan publishes aggregate trade statistics only. Japanese importer names come from mirrored partner-country shipment records.
What does Japan import the most?
Mineral fuels lead at $147.9 billion, 19.6% of Japan's $755.5 billion import bill in 2025, followed by electrical machinery (HS 85) at $114 billion and machinery including computers (HS 84) at $82.9 billion, per MOF figures compiled by World's Top Exports.
The full top ten by HS chapter, the view you get reading Japan import data by HS code:
| HS chapter | Category | 2025 imports |
|---|---|---|
| 27 | Mineral fuels and oils | $147.9B |
| 85 | Electrical machinery and equipment | $114.0B |
| 84 | Machinery including computers | $82.9B |
| 30 | Pharmaceuticals | $32.5B |
| 90 | Optical, technical, medical apparatus | $29.1B |
| 26 | Ores, slag, ash | $25.7B |
| 87 | Vehicles and parts | $24.8B |
| 39 | Plastics and articles | $16.4B |
| 71 | Gems and precious metals | $16.1B |
| 29 | Organic chemicals | $14.5B |
The direction of travel matters more than the ranking. Machinery including computers grew 13.8%, the fastest of any top-ten category, on data-center and chip-equipment demand. Vehicles rose 7.8% and electrical machinery 7.4%, while the fuel bill fell 12.4% on softer LNG and coal prices. Down at the fine-grained lines, swings get wilder: telephone-set imports jumped 33.6% in H1 2025, per the MOF half-year release. New to chapter codes? Start with how HS codes work.
Where does Japan import data actually come from?
One source outranks all others: Trade Statistics of Japan, compiled by Japan Customs under the Ministry of Finance and published free at customs.go.jp and on the e-Stat portal. Provisional monthly figures land about three weeks after month-end, cut by commodity, partner country and port. Japan classifies goods on a 9-digit statistical code, the international 6-digit HS heading plus a 3-digit domestic suffix, so the tables go deep enough to separate frozen surimi from frozen shrimp.
What Japan customs data will not give you is a name. Japan, like most of Asia and Europe, publishes aggregates only: no bill-of-lading manifests, no consignee fields, nothing like the public US import records. You cannot ask the official tables which Osaka company imported polypropylene last quarter. Exporters close that gap with mirror data, partner-country shipment records that show goods flowing into Japan and carry the Japanese consignee where disclosure rules allow. The method is the standard one for finding buyers with customs data; Japan simply forces you to start from the partner side.
What Japan import data reveals: an old, rich buyer spreading its bets
Partner tables first. China shipped ¥12.85 trillion of goods to Japan in January-June 2025, up 6.9%, roughly 23 yen of every 100 Japan spent on imports; Asia as a whole supplied ¥27.1 trillion, nearly half the total. The US followed at ¥6.18 trillion (down 5.0%), the EU at ¥6.28 trillion (up 11.5%), then Australia at ¥3.39 trillion of coal, LNG and iron ore, the UAE at ¥2.52 trillion of crude, and Taiwan at ¥2.37 trillion, heavy in chips.
Behind those tables sits demography. Roughly 30% of Japan's population is 65 or older, per World Bank data, the oldest major economy on earth. Fewer workers and farmers show up in the trade ledger: the calorie-based food self-sufficiency rate has sat at 38% for four consecutive years, far below the government's 45% target for fiscal 2030, per The Japan Times. An economy built like this does not import out of preference.
It is also re-wiring where it buys. In the JBIC FY2025 survey of Japanese manufacturers, India ranked the most promising business destination for the fourth straight year, picked by over 60% of respondents, and a majority of firms said they are diversifying procurement away from Japan-plus-China toward India, South Korea, Vietnam and Thailand.
An importer that is old, rich and short of hands is the best kind of customer: it has budget, it needs volume, and it cannot make everything itself.
The India-Japan lane: CEPA plus a 25.6% surge
The treaty layer has been in place since August 2011. The India-Japan CEPA commits both sides to abolishing tariffs on 94% of traded lines over ten years, per India Trade Portal, and the volume layer is finally moving: Japan's imports from India rose 25.6% in H1 2025, the sharpest climb among its major Asian suppliers, though from a modest base of ¥565.6 billion. Bilateral trade totalled $25.17 billion in FY2024-25 and $18.45 billion in April-November of FY2025-26, still lopsided: $14.58 billion flowed into India against $3.87 billion the other way, per IBEF.
What India sells Japan today: vehicles and auto components ($695.72M), machinery ($421.87M), organic chemicals ($412.41M) and marine products ($287.65M) led the lane in FY26 through November. Tokyo has framed the next decade around a ¥10 trillion private-investment target announced during PM Modi's August 2025 visit. For exporters working this corridor, the winning play is data-backed targeting: map which Japanese buyers already purchase your HS code, then build the shortlist before the first email.
Food, pharma, textiles: three doors standing open
Food. Japan spent ¥5.02 trillion on foodstuff imports in H1 2025 alone, up 4.1%, and a 38% self-sufficiency rate guarantees that bill keeps coming. Marine products, processed foods and grain-adjacent staples all ride this current, and the buyer-hunt works like any food and agro data workflow. One caution from practitioners: Japanese buyers test residue limits and labeling before the first container ships, not after, so budget the compliance round into your timeline.
Pharma. Japan runs the world's third-largest drug market at ¥12.4 trillion (about $88 billion) and imported $32.5 billion of pharmaceuticals in 2024; around 90% of antibody drugs sold in Japan are manufactured overseas, per the US commercial guide. Medical-product imports climbed another 17.4% in H1 2025. A years-long generic-drug supply crunch has pushed Japanese firms to source APIs and finished generics abroad, a door that barely existed a decade ago.
Textiles. Fully 98.2% of clothing sold in Japan is imported, per industry figures, and apparel imports reached $24.3 billion in FY2025-26, up 2.8%, per Fibre2Fashion. China still dominates HS 61-62 supply with Vietnam second, but Tokyo sourcing desks keep widening the pool. One knitwear exporter tracking mirror records into Japan watched Bangladesh-origin consignments climb three quarters in a row while Chinese volumes sat flat, and repriced accordingly before any buyer said the word "diversification".
How do you find Japanese importers?
You work two layers: aggregate statistics to pick the product-market, mirror shipment records to name the buyers. The sequence:
- Fix the HS code first. Japan files on 9-digit statistical codes; get the 6-digit heading right and every later filter works.
- Read the official trend. Five minutes on customs.go.jp shows whether your category grew last quarter, and through which ports.
- Pull mirror shipment records. Partner-country export data shows shipments into Japan with values, volumes and, where available, the Japanese consignee.
- Rank by consistency, not size. A buyer landing a container every month beats a one-off bulk order that never repeats.
- Expect trading houses. Many records name a sogo shosha or specialist trader rather than the end user; pitch the product division that already handles your chapter.
A big share of the importers you surface in Japanese lanes are trading companies. Treat the shosha as the door, not the destination.
How ShipScout helps
ShipScout puts 11B+ shipment records across 240+ countries behind one search box, including the Japan import data trail visible through partner-country records, so the sequence above takes minutes:
- Search your product or HS code with Japan as destination and see real flows: values, volumes, origins, dates.
- Rank Japanese importers by shipment count and recency instead of guessing from directories.
- Profile before pitching. Open any company in the importer directory to check trade history, sourcing countries and product mix.
- Reach out with contact intelligence where available, and open with numbers from the buyer's own lane.
A ¥113 trillion import bill means somebody in Japan already buys what you make. Start a free trial and pull your first ranked list of Japanese buyers today.
See who’s importing goods into Japan right now.
ShipScout turns 11B+ shipment records across 240+ countries into a live list of verified buyers and suppliers — ranked by volume, with the contacts to reach them. Create a free account and run your first search in minutes.
Start your free trial →