Canada import data tells a blunt story for 2025: a country of just 41 million people bought CAD $789.0 billion of goods — roughly US$564 billion — up 2.8% on the year, and ran its widest trade deficit since 2020 at $31.3 billion, per Global Affairs Canada. Almost none of that buying shows up in a public manifest. This guide breaks down what Canada imports, who supplies it, where the trade numbers actually live, and how to turn shipment records into a ranked list of Canadian importers you can email.
The 30-second version
- Canada imported CAD $789.0 billion (~US$564B) of goods in 2025, up 2.8%; the $31.3B trade deficit was its widest since 2020.
- Machinery including computers (US$87.5B) and vehicles (US$87B) lead the shopping list; gems and precious metals grew fastest at +36.5%.
- The United States still supplies 46.2% of imports, but that is a record low — down from 49.6% in 2024 — as Canadian importers diversify away from tariff risk.
- India-Canada goods trade hit US$8.66 billion in FY2024-25; leaders relaunched CEPA talks in November 2025, targeting roughly $50 billion by 2030.
- Canada's border agency, CBSA, does not publish importer-level customs records. Canadian buyer names come from mirrored partner-country shipment data.
What does Canada import the most?
Machinery including computers leads at US$87.5 billion, 15.5% of Canada's import bill, just ahead of vehicles at US$87 billion (15.4%) and electrical machinery at US$51.9 billion (9.2%), per World's Top Exports. Those three chapters alone cover four of every ten dollars Canada spends abroad.
The full top ten, the view you get reading Canada import data by HS chapter:
| HS chapter | Category | 2025 imports (US$) |
|---|---|---|
| 84 | Machinery including computers | $87.5B |
| 87 | Vehicles | $87.0B |
| 85 | Electrical machinery, equipment | $51.9B |
| 27 | Mineral fuels including oil | $34.3B |
| 71 | Gems, precious metals | $26.2B |
| 39 | Plastics and articles | $19.3B |
| 30 | Pharmaceuticals | $18.8B |
| 90 | Optical, technical, medical apparatus | $16.2B |
| 73 | Articles of iron or steel | $11.5B |
| 94 | Furniture, bedding, lighting | $9.6B |
The movement matters more than the ranking. Gems and precious metals jumped 36.5% year on year, the fastest of any top-ten category, driven by gold. Statistics Canada's own cut of the year flags metal ores and non-metallic minerals up 33.6% and consumer goods up 4.7%, per the December 2025 trade release. New to chapter codes? Start with how HS codes work, because every filter downstream depends on getting the six digits right.
Where does Canada import data actually come from?
Official Canada import data comes from one place: Statistics Canada, built on customs entries filed with the Canada Border Services Agency (CBSA) and published free, cut by commodity, partner country and province. Provisional monthly figures land about five weeks after month-end. That is the macro layer, and it is excellent for sizing a market.
What it will not give you is a name. CBSA collects detailed cargo and importer data through its eManifest program, but keeps it confidential — there is no public bill-of-lading feed like the one behind US import records. You cannot ask the official tables which Ontario firm bought industrial pumps last quarter. Exporters close that gap with mirror data: partner-country shipment records that show goods flowing into Canada and carry the Canadian consignee where disclosure rules allow. The workflow is the standard one for finding buyers with customs data; Canada simply forces you to start from the exporting side of the lane.
What Canada import data reveals about its suppliers
The supplier table is where the 2025 story turns. The United States still sold Canada CAD $361.7 billion of goods, but its share fell to 46.2% — the lowest on record since 1946, down from 49.6% a year earlier, per Global Affairs Canada. China followed at $90.6B (11.5%) and Mexico at $53.4B (6.8%, up 12.5%). Below them, the fast movers tell you where sourcing desks are looking: Vietnam +31.0%, Switzerland +28.3%, and India +20.6% to CAD $9.7B, now a top-ten supplier.
| Supplier | 2025 imports (CAD) | Share | YoY |
|---|---|---|---|
| United States | $361.7B | 46.2% | −4.2% |
| China | $90.6B | 11.5% | +1.9% |
| Mexico | $53.4B | 6.8% | +12.5% |
| Germany | $25.1B | 3.2% | +6.3% |
| Japan | $21.1B | 2.7% | −1.3% |
| Vietnam | $19.3B | 2.4% | +31.0% |
That three-point drop in the US share is not a rounding blip. It is billions of dollars of Canadian demand actively looking for a new home, pushed by cross-border tariff friction. For an exporter in India, Vietnam or the EU, that is the opening line of the pitch.
When a buyer's biggest supplier becomes its biggest political risk, the purchasing manager starts taking cold emails from new origins. 2025 is that year for Canada.
Canada's ports: Vancouver, Montreal and Prince Rupert
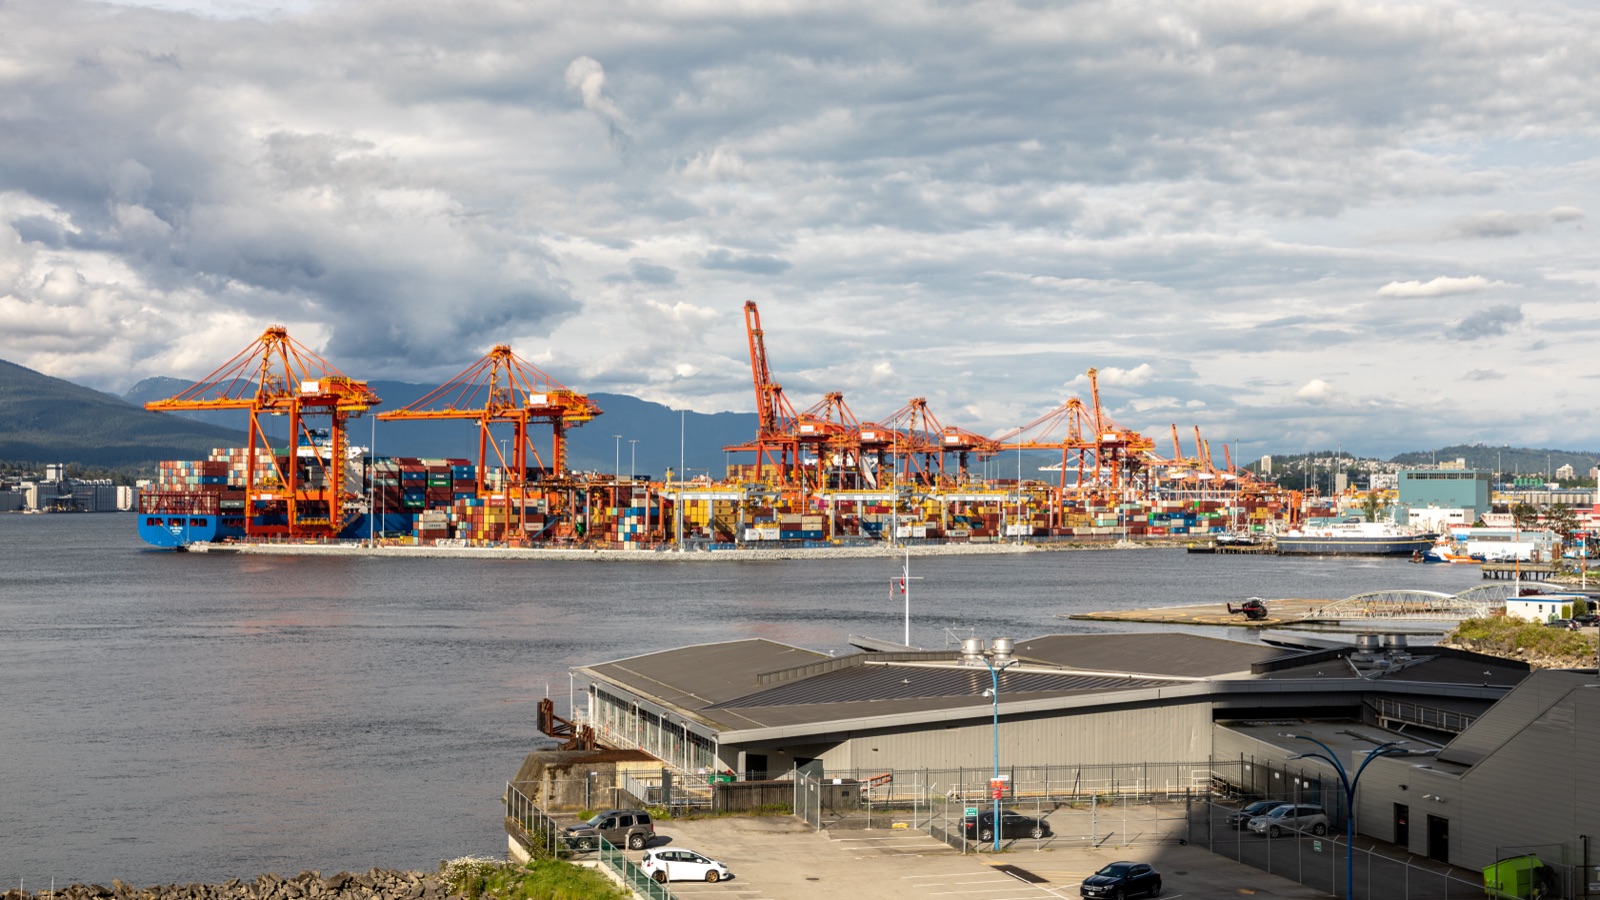
Three gateways move most of the containers, and each points at a different lane. The Port of Vancouver — the country's largest — handled a record 158 million tonnes in 2024 and 3.47 million TEUs, with laden inbound containers up 14%; it is Canada's front door for Asian goods, with China, Japan and South Korea its top partners. On the Pacific north coast, Prince Rupert moved 23.1 million tonnes and 739,315 TEUs through its Fairview terminal, prized for the fastest rail run to Chicago. In the east, the Port of Montreal handled 35.26 million tonnes and about 1.7 million TEUs, the main gateway for European and Mediterranean cargo and a spillover door into the US Midwest.
Why a seller should care: the port of entry on a shipment record is a location signal. An importer clearing through Montreal is likely serving Quebec, Ontario and the US Northeast; one on the Vancouver-Prince Rupert axis is usually running an Asia-Pacific supply chain. That tells you which sales story to lead with before you ever pick up the phone.
The India-Canada lane: CEPA is back on the table
The politics thawed fast in 2025. After two frozen years, Prime Ministers Carney and Modi met at the G7 in Kananaskis to reset ties, then formally relaunched negotiations for a Comprehensive Economic Partnership Agreement (CEPA) in November — with a stated goal of lifting bilateral trade to roughly $50 billion by 2030.
The base they are building on: India-Canada goods trade reached US$8.66 billion in FY2024-25, with India's exports up 9.8% to US$4.22 billion, per IBEF. What India sells into Canada today is exactly what Canada imports heavily: pharmaceutical products, machinery, gems and precious stones, articles of iron and steel, and organic chemicals. Canada's own numbers agree the lane is warming — India was its fastest-climbing major supplier at +20.6% in 2025. For exporters, the winning move is data-backed targeting: map which Canadian buyers already purchase your HS code, then build the shortlist before a tariff deal makes the lane crowded.
How do you find buyers in Canada?
You work two layers: aggregate statistics to pick the product-market, then mirror shipment records to name the Canadian importers. The sequence practitioners actually use:
- Fix the HS code first. Get the six-digit heading right and every downstream filter, from Statistics Canada tables to shipment records, lines up.
- Size it with the official data. Ten minutes of Canada trade data shows whether your category grew last year and which suppliers are gaining or losing ground.
- Pull mirror shipment records. Partner-country export data shows shipments into Canada with values, volumes, ports and, where available, the Canadian consignee.
- Rank by consistency, not size. A buyer landing a container every month beats a one-off bulk order that never repeats.
- Read the port. Vancouver versus Montreal tells you the buyer's region and supply chain before your first message.
Directories give you a company name. Trade records give you a buyer who has already paid to import your exact product — start there.
How ShipScout helps
ShipScout puts 11B+ shipment records across 240+ countries behind one search box, including the Canadian import trail visible through partner-country records, so the sequence above takes minutes rather than weeks:
- Search your product or HS code with Canada as destination and see real flows: values, volumes, origin countries, ports and dates.
- Rank Canadian importers by shipment count and recency instead of guessing from a static directory.
- Profile before pitching. Open any firm in the importer directory to check its trade history, sourcing countries and product mix, and cross-reference India-based exporters already in the lane.
- Reach out with contact intelligence where available, and open with a number pulled from the buyer's own shipment record.
A CAD $789 billion import bill means somebody in Canada already buys what you make. Start a free trial and pull your first ranked list of Canadian buyers today.
See who’s importing goods into Canada right now.
ShipScout turns 11B+ shipment records across 240+ countries into a live list of verified buyers and suppliers — ranked by volume, with the contacts to reach them. Create a free account and run your first search in minutes.
Start your free trial →